5.8.1 Midpoint Displacement

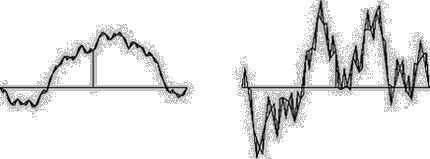
As mentioned in picture 20 "Midpoint Displacement" the area under a parabola can be measured by the midpoint displacement method, in which the height of a certain step is related to the heights of the step before by the formula height(n+1)=(1/4)*height(n). Landsberg, a mathematician, scaled the vertical lines by a certain factor “w” instead of using 1/4, which is expressed by the formula height(n+1)=w*height(n). To get a curve out of this formula one starts with a horizontal line and draws a vertical line of any length from the center, connecting this new point with the two outer points of the starting line. This procedure is repeated for the two new outer oblique lines, this time using the formula from above for defining the length of the displacement. The instruction is then repeated recursively until infinity. For getting more natural looking curves the decision whether a new line moves up or down can be decided at random. Landsberg found out that the curves produced by this formula are fractals if the value for “w” is higher or equal to 0.5 and lower or equal to 1.0. The fractal dimension is then given by the formula D=2 - | log2* w |, see picture 57[01].

picture 57: Midpoint displacement - curves

Two curves produced by the midpoint displacement method with a fractal dimension D=1.3 - on the left - and D=1.8 - on the right side. Whether the curve moves up or down has been decided by using a coin. The pictures show the first to the sixth stage.

A more complex form of the midpoint displacement method is the so-called Gaussian midpoint displacement, in which the displacement at each step is determined by a random choice from a Gaussian distribution. Following from that some of the displacements chosen at random will be positive and some negative, some will be large and others small. This time the displacement at each step will be scaled by a factor referred to as the Hurst exponent, which varies between 0 and 1. The scaling factor “W” is generated through the equation W=1/(2H), which means that if the Hurst exponent increases the scaling factor decreases and by that the fluctuations in the midpoint displacement process are getting smaller[02] . The fractal dimension results from the relation D=2-H.

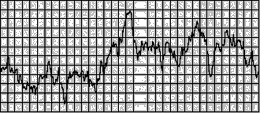
H.E. Hurst was a hydrologist who analyzed the variation of natural systems through time, like the variation of temperature, pressure, lake levels and tree rings, in which the so-called Hurst exponent can compare the variation. For determining the exponent the "rescaled range analysis" is used. There the size of maximum fluctuation of a variable is observed over a range of time scales. First a grid is placed over the curve, which should be measured, with the horizontal axis defining the time line and the vertical grid that of the fluctuation. Now the maximum fluctuation can be measured. In the next step the curve is divided into two parts of 1/2 of the whole time sequence. This time the measurement results in two maximum fluctuations, of which the average maximum fluctuation is calculated. This is then repeated for 1/4 time sequences and so on[03]. Finally the Hurst exponent is measured through a log-log graph of the maximum fluctuation range versus the time scale. In that graph the slope of the line determines the experimental Hurst exponent[04].

5.8.1.a Fractal Rhythms

By rescaling range analysis, the fractal dimension of fractal rhythms in nature or man made compositions can be calculated, including the distribution of trunks in a wood, columns and walls. The main difference between Euclidean and fractal-rhythm-based grids lies in the complexity and in the lower symmetrical distribution of the latter, in which it is valid that the higher the fractal dimension of the grid, the more clearly the differences of the spaces, the jumps of width, can be seen. So again the fractal dimension is a measurable characteristic of order, with low dimensions near one, and surprise, with higher dimensions up to two[05].

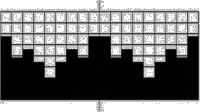
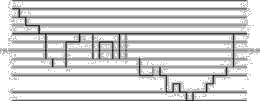
As examples for fractal rhythms, buildings by Frank Lloyd Wright are valid, such as the grid of the major plan elements of the Willits House indicates. For measuring the fractal dimension of the grid the rhythmic variation can be translated into a bar chart, in which the different heights of the bars represent the different widths. Then the Hurst exponent and from that the fractal dimension can be determined. The horizontal width of the bars does not affect the calculation, see picture 58.

picture 58: Frank Lloyd Wright

Willits house - Fractal rhythm

Frank Lloyd Wright - Willits house

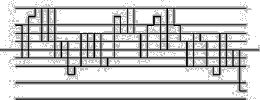
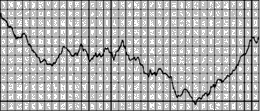
The picture above shows the ground plan of the Willits house overlapped by a planning grid based on the major elements, which has been translated into the step-function displayed below - at which the heights of the charts represent the widths of the grid lines from the left to the right and from the upper side of the plan to the bottom.

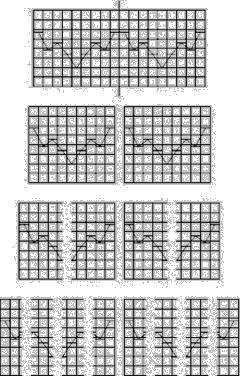
For getting the Hurst exponent and by that the fractal dimension of the curve, the rescaled range analysis is used, at which the size of the maximum fluctuation of a variable over a range of time scales is looked at. For doing so, the step-function is first translated into a curve and overlapped by a grid, which is shown on picture below. By that the maximum fluctuation of the whole curve can be measured which results in 55.17 units. Then the curve is divided into two pieces with a time length of 1/2 each, giving two maximum fluctuations - 42.15 and 55.17 - which leads to an average value of 48.66. Four pieces, each of which represents a time length of 1/4, lead to maximum fluctuations of 43.56, 36.66, 31.88 and 55.17 with an average value of 41.82. Finally eight pieces lead to an average value of 30.56. Then the slope of the graph of the log(maximum fluctuations) versus the log(time scale) determines the Hurst exponent - H=0.28 and the fractal dimension D=2-H=1.72.

Andrea Palladio - Villa Rotunda

The layout of Palladio’s Villa Rotunda is based on a strict Euclidean grid that is symmetrical in two directions.

average values of the maximum fluctuations:
1st time scale=45.5 units 2nd time scale=45.5 units
3rd time scale=45.5 units 4th time scale=32.6 units
Hurst exponent (H)=0.14; fractal dimension D(1-4)=2-H=1.86
These results show that the grid does not offer any differences - variations - for the first three time scales - Hurst exponent=0 and D(1-3)=2.

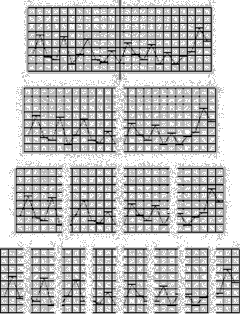
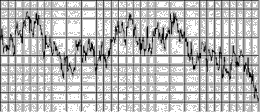
Chapter "5.6.3 Landscape and Building" dealt with similar fractal dimensions of the elevation, e.g. the window strips, and the surroundings, e.g. the site-plan and mountain ridge, which results in a homogeneous whole. The fractal dimension of the environment can be measured by the box-counting method or if it follows a certain rhythm by the rescaling range analysis. The measured fractal dimension and the Hurst exponent respectively of the environment can then be used as a source for producing a fractal “noise curve” by midpoint displacement. From this fractal “noise curve” a horizontal center of the distribution is drawn as a reference-line. At the next step a grid is placed over the curve, with the grid size taken from an architectural module size. One possible module is based on the ground size M=100 millimeters - following from that 1M=10cm, 6M=60cm, 12M=120cm[06]. By this grid the fractal noise curve can be translated into a step function. The heights of the steps are the distances of the rhythm of a certain fractal dimension, see picture 59[07].

picture 59: Hurst curve - Fractal rhythm

The following pictures show the translation of two fractal curves - produced with the computer program “Benoit” - into step functions for getting two different planning grids, which may be used for the distribution of windows or walls. The resulting grids are given below the step functions in each case, using the width of 130cm for the base line and plus or minus 10cm steps for each line moving up or down respectively.

curve 1: Hurst-exponent=0.5, D=1.5

curve 2: Hurst-exponent=0.3, D=1.7

Subsequently there are still many different possibilities to choose from. First there are different curves of the same fractal dimension; each time a curve is generated the resulting step-function looks different, but on the whole the character is similar. That means that curves of a high fractal dimension are rougher than curves with a lower dimension, which are smoother, i.e. there are no high jumps. Second the interpretation of the step function belongs to the planner, e.g. the first twenty steps may form the vertical rhythm, whereas the following are used as the horizontal ones. But it is also up to him which lines are decided to be walls and which open fields.

5.8.1.b Visually Distinguishable Size

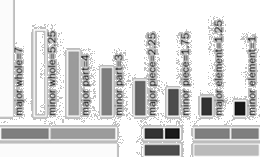
The problem when translating of a noise curve into a sequence is the distinguishable size differences between the single widths. Carl Bovill solved this problem with the architectural scale based on human ability by Dom H. Van Der Laan. This architectural scale is based on the maximum distinguishable size differences between certain elements, with the major whole being defined by 7 units, the minor whole by 5.25, the major part by 4, the minor part by 3, the major piece by 2.25, the minor piece by 1.75, the major element by 1.25 units and finally the minor element by 1 unit. Through the step function a sequence of values can be given depending on the heights of the steps, e.g. 1, 3, 5, 4, 7, 6, 3, 6, and so on. These values are then translated by means of the architectural scale of Dom H. Van Der Laan, in which 1 is defined as the minor element, 2 the major element, ... and finally 8 being the major whole, see picture 60[08].

picture 60: Visually distinguishable size

Sequence of elements based on the Van Der Laan scale, starting with the major whole on the left side. Translated in [cm] starting with 130cm being the width of the major whole the sequence runs: 130/97.5/74.3/55.7/41.8/32.5/23.2/18.6

"major part" + "minor part"="major whole"
"major element" + "minor element"="major piece"
"major piece" + "minor piece"="major part"

curve 1: The grid of the step-function from picture 59 with a fractal dimension D=1.5, using the Van Der Laan scale.

curve 2: The grid of the step-function from picture 59 with a fractal dimension D=1.7, using the Van Der Laan scale.

5.8.1.c Some Examples of Fractal Rhythms

Smooth prefabricated concrete walls for noise abatement of the same height can be interpreted as two-dimensional areas of nearly endless width in the sense of Euclidean geometry. These boring unity walls in most cases have no relation to the environment such as a forest-top situated behind them, which mostly offers a fractal dimension of 1.3, or a mountain ridge. This fractal dimension can be used as the starting value for a fractal rhythm, generated as a step function of a noise-curve. The resulting concrete wall then consists of prefabricated elements of different widths and heights, which offer a mixture of order and surprise in the same way the background nature does - the fractal rhythm leads to a variation of a complex rhythm, where expectations are confirmed, see picture 61[09]. Fractal rhythms can also be used for the sizes and sequences of window strips, but also as a planning grid for different heights and widths of the front view of row houses.
In comparison with fractal rhythm sheet music, as a source of fractal distribution, can be used for design. The notes of the music are then translated into a fractal rhythm by interpreting the staff lines as different heights of a step function. By that the ledges and setbacks of a group of houses, the widths of the single houses and the depths can be determined. The advantage of the midpoint displacement method over music is that the fractal dimension can be regulated and determined in the first case.

picture 61: Concrete walls for noise abatement

straight concrete walls, for a noise abatement in front of treetops

walls with a fractal rhythm, D=1.3, for a noise abatement in front of treetops

fractal curve with a fractal dim. of 1.3

fractal curve resolved into a step function

5.8.2 IFS in Architecture

Another possible application of fractal geometry to architecture is through the phenomenon of IFS, the iterated function system. Here the rules are more important than knowing what will be produced from the very beginning, which means that the results are influenced by the instructions and not by the primary products. Thus the planning method is the mechanism, rule or instruction and not the resulting form - which we do not know when we start the procedure.

In a lecture held by Wolff Plotegg at the Technical University of Vienna he demonstrated some examples of his own, produced by rules without knowing what the result would be. E.g. designing a door normally means that its main function is opening and closing a room. Everyone has a certain idea what a door may look like, that is because of our experience. The opening-mechanism is in most cases vertically, the door itself is a thin rectangular object, and its only function is that of opening and closing. But then Wolff Plotegg thought about other rules: first the opening mechanism should be horizontal on the ground, the door itself should be a thick object and he defined another, second function of the door, it should also be a staircase. The result is not a door the way we all know, but a newly designed one.

5.8.3 Mathematical Fractals

As mentioned in chapter "5.5.7.b Greg Lynn", Greg Lynn used a process rule for the basic shape which led to a mathematical fractal. Only then he translated and adopted it to the surroundings and the function.

Footnotes

[01] Bovill Carl, Fractal Geometry in Architecture and Design (1996), Birkhäuser Bosten, ISBN 3-7643-3795-8, p.76.
[02] The fluctuations of the fractal curve are statistically self-similar, which means that one part of the curve is not an exact copy of other parts but they are statistically similar. To show this similarity one can zoom in on the curve, but if the vertical and horizontal scaling factor is equal to one, then the resulting curve will be rougher than the original curve. If a horizontal scaling factor of two is choosen instead, the curve will flatten out. Instead of that a properly rescaling can be reached by changing the rescaling factor for the horizontal direction to the value of two and for the vertical direction to the result of 2H. Bovill Carl, Fractal Geometry in Architecture and Design (1996), Birkhäuser Bosten, ISBN 3-7643-3795-8, p.81/82.
[03] This time it does not matter if the horizontal axis is streched or not because the vertical fluctuations stay the same with the grid. Bovill Carl, Fractal Geometry in Architecture and Design (1996), Birkhäuser Bosten, ISBN 3-7643-3795-8, p.82-87.
[04] The algorithms of computer programs that generate fractal noise curves are approximations in their simulations which lead to the fact that generated curves with a dimension above 1.5 will result in a little bit lower measured dimensions, respectively curves generated to have fractal dimensions below 1.5 will offer higher measured dimensions. Bovill Carl, Fractal Geometry in Architecture and Design (1996), Birkhäuser Bosten, ISBN 3-7643-3795-8, p.88.
[05] Bovill Carl, Fractal Geometry in Architecture and Design (1996), Birkhäuser Bosten, ISBN 3-7643-3795-8, p.167-169.
On the one hand too much order does not bring up any surprise, which leads to the fact that the following parts are known, that is determined, from the very beginning - music or architecture is then regarded as boring. On the other hand too much surprise destroys any direction, its parts can be put together in any way, there is not any sequence at all - man is upset and loses any kind of possible orientation.
[06] Fuhrmann Peter, Bauplanung und Bauentwurf: Grundlagen und Methoden der Gebäudelehre (1998), W. Kohlhammer GmbH Stuttgart, p.13.
[07] Bovill Carl, Fractal Geometry in Architecture and Design (1996), Birkhäuser Bosten, ISBN 3-7643-3795-8, p.91.
[08] Bovill Carl, Fractal Geometry in Architecture and Design (1996), Birkhäuser Bosten, ISBN 3-7643-3795-8, p.158-164.
[09] Bovill Carl, Fractal Geometry in Architecture and Design (1996), Birkhäuser Bosten, ISBN 3-7643-3795-8, p.174.

eCAADe 2024:
Urban Street Space Analysis with Spherical Box-Counting

Urban Street Space Analysis with Spherical Box-Counting: Holistic digital Gestalt analysis of architecture in urban space
Talk and Proceeding: eCAADe 2024 – Data-Driven Intelligence (Nicosia, Cyprus | conference)

Spherical box-counting of urban street spaces is a novel method developed and refined by the authors to produce highly specific topological fractal fingerprinting of architecture in relation to observer position and in the context of the accompanying surroundings. ...

eCAADe 2024:
Visualizing Urban Transformations using a 3D Cellular Automaton

Visualizing Urban Transformations using a 3D Cellular Automaton
Talk and Proceeding: eCAADe 2024 – Data-Driven Intelligence (Nicosia, Cyprus | conference)

Urban transformation is key to achieving more livable and sustainable cities. However, modelling this evolution is highly non-trivial since there are many factors at play that manifest themselves in the built (or: non-built/restored) environment. In our most recent work, we have represented urban change as rules of a three-dimensional Cellular Automaton. ...

Entwerfen Reuse, Recycle, Reduce

Algorithmisches Bauen mit und für die Kreislaufwirtschaft

Das Entwerfen mit dem Titel „Reuse, Recycle, Reduce: Algorithmisches Bauen mit und für die Kreislaufwirtschaft“ verbindet die Planung eines mehrgeschoßigen Wohngebäudes mit digitalen Entwurfsstrategien.