6.2.4 Helping Tool

6.2.4.a Mathematical Fractals

As indicated before, some mathematical fractals can be used as a visual help for planning streets, footpaths and the like under the view-point of irregularity or in line with the question about how much of a certain area can be supplied - the higher the fractal dimension the higher the irregularity and the more of the entire space can be reached. Besides, fractals may also act as a first approach for defining the distribution of buildings or the size and position of properties, the fractal dimension of the resulting site-plan saying something about the irregularity of the project - see picture 79.

picture 79: Simulations

6.2.4.b Curdling

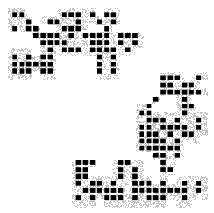
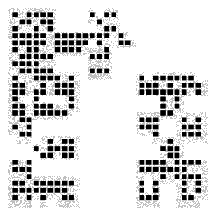
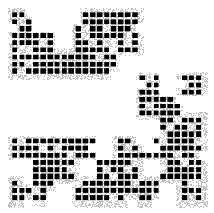
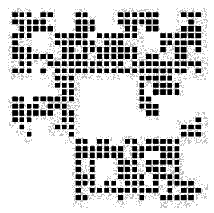
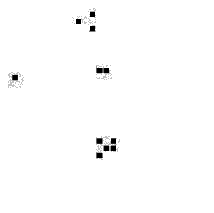
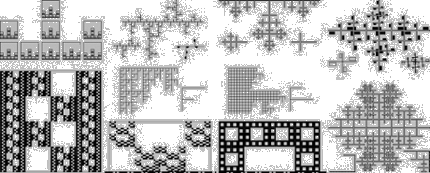
Mandelbrot named the process that produces a fractal dust, which is a disconnected set of points with clustered characteristics, "curdling". Examples for such a fractal dust are the Cantor set, introduced in chapter "3.1.1 Cantor Set", as well as the cluster of stars and galaxies in the night sky, with the latter clustering, in contrast to the first, includes some randomness. How can the "curdling" process be described? First, the starting image, which may be a square, is divided into a certain number of pieces - the following example uses a division into nine pieces that produces a grid of three columns by three rows. In the next stage, chance decides which of these nine squares or boxes remain and which ones are removed from the grid. This can be done by a random number generator, or if the random choice is one half, simply with the aid of a coin. The concept of "curdling" is that the mass of the material of the original number of squares flows into the remaining ones. In the next stage, the procedure is repeated for the squares that are kept up - hence each of them is once more divided into nine smaller squares and again the decision whether the new ones remain on the grid or not is made by chance. This process can be repeated until infinity with using the same or different probabilities for keeping up the squares at each stage - see picture 80[01].

picture 80: Curdling

D(1/s -1/s)=(logN(n)-logN(n-1))/((log(1/s(n))-log(1/s(n-1)))

theoretical dimension for the possibility of 2/3: 
N(1)=9*2/3=6, s(1)=1/3; N(2)=6*9*2/3=36, s(2)=1/9; N(3)=36*9*2/3=216, s(3)=1/27;
D(3-9)=(log36-log6)/(log9-log3)=1.631;
D(9-27)=(log216-log36)/(log27-log9)=1.631;
calculated dimension - example 1):
N(1)=5, s(1)=1/3; N(2)=31, s(2)=1/9; N(3)=177, s(3)=1/27;
D(3-9)=(log31-log5)/(log9-log3)=1.661; D(9-27)=1.596;
calculated dimension - example 2): 
N(1)=6, s(1)=1/3; N(2)=38, s(2)=1/9; N(3)=235, s(3)=1/27;
D(3-9)=(log38-log6)/(log9-log3)=1.680; D(9-27)=1.659;

theoretical dimension for the possibility of 5/6: 
N(1)=9*5/6=7.5; N(2)=7.5*9*5/6=56.25; N(3)=421.875;
D(27-9)=(log421.875-log56.25)/(log27-log9)=1.834;
calculated dimension - example 3):
N(1)=6; N(2)=41; N(3)=299; D(3-9)=1.749; D(9-27)=1.809;
calculated dimension - example 4): 
N(1)=7; N(2)=47; N(3)=341; D(3-9)=1.733; D(9-27)=1.804;

theoretical dim. for the possibility of 2/9: D=0.631;
calculated dimension - example 5):
N(1)=3; N(2)=4; N(3)=11; D(3-9)=0.262; D(9-27)=0.921;


The fractal dimension of a fractal dust, produced in such a way, can be measured with the aid of the box-counting method, using the formula

- introduced in chapter "4.2.3 Box-Counting Dimension 'Db'". There "Nsn" represents the number of boxes that remains at a certain grid size "sn" - stage -, which is defined as the factor of reduction or the reciprocal value of the number of columns of the specific grid. Relating the probability to the fractal dimension it turns out that the fractal dimension decreases when the probability becomes smaller and that there exist some upper and lower limits. Thus the upper limit is given when all squares remain at each stage, which means a probability equal to one and a fractal dimension of two. The lower limit of the example with a division into nine pieces at each stage is given by one ninth, because then only in the ideal case one square remains at each step until infinity, while in reality no or two squares may also be likely - if only one square is counted at each step, the fractal dimension decreases to zero: log1-log1=0. Finally in the case of a probability lower than one ninth, it is unlikely that any square will remain at some stage[02].

The "curdling" process, as described in this section, produces a fractal dust that may act as a first sketch of a site plan for one-family houses or row houses, the fractal dimension indicating the density. In this connection the environment, a mountain ridge or the like, can be used as an instruction for the "curdling" process in so far that the probability can be derived from the measured fractal dimension of this surrounding. But repeating the "curdling" process with the same starting options, that is probabilities, results in different shapes, which is also pointed out by different actual fractal dimensions - the theoretical fractal dimension is generated with the remaining boxes of the ideal case of a certain probability. Thus a couple of "site-plans" of the same probability can be generated, where finally the most useful "site-plan" elaborated further by adapting it to the surroundings, such as existing roads, hills or rivers.

Footnotes

[01] Bovill Carl, Fractal Geometry in Architecture and Design (1996), Birkhäuser Bosten, ISBN 3-7643-3795-8, p.92-93.
[02] Bovill Carl, Fractal Geometry in Architecture and Design (1996), Birkhäuser Bosten, ISBN 3-7643-3795-8, p.98-99.

eCAADe 2024:
Urban Street Space Analysis with Spherical Box-Counting

Urban Street Space Analysis with Spherical Box-Counting: Holistic digital Gestalt analysis of architecture in urban space
Talk and Proceeding: eCAADe 2024 – Data-Driven Intelligence (Nicosia, Cyprus | conference)

Spherical box-counting of urban street spaces is a novel method developed and refined by the authors to produce highly specific topological fractal fingerprinting of architecture in relation to observer position and in the context of the accompanying surroundings. ...

eCAADe 2024:
Visualizing Urban Transformations using a 3D Cellular Automaton

Visualizing Urban Transformations using a 3D Cellular Automaton
Talk and Proceeding: eCAADe 2024 – Data-Driven Intelligence (Nicosia, Cyprus | conference)

Urban transformation is key to achieving more livable and sustainable cities. However, modelling this evolution is highly non-trivial since there are many factors at play that manifest themselves in the built (or: non-built/restored) environment. In our most recent work, we have represented urban change as rules of a three-dimensional Cellular Automaton. ...

Entwerfen Reuse, Recycle, Reduce

Algorithmisches Bauen mit und für die Kreislaufwirtschaft

Das Entwerfen mit dem Titel „Reuse, Recycle, Reduce: Algorithmisches Bauen mit und für die Kreislaufwirtschaft“ verbindet die Planung eines mehrgeschoßigen Wohngebäudes mit digitalen Entwurfsstrategien.