VIII Statistics
The different characteristics, qualities and dimensions of images of floor plans and elevations of buildings have been registered and then analyzed with "SPSS for windows" subsequently.
The different characteristics, qualities and dimensions of images of floor plans and elevations of buildings have been registered and then analyzed with "SPSS for windows" subsequently.
Each data-sheet consists of a "general part" with information about the building, including:
-) the name of the object,
-) the village or town where it can be found,
-) the architect if known,
-) the year of construction - mostly the year of beginning -,
-) the size - area in m2 -,
-) the reference - in which source, publication the image can be found -,
-) the kind of origin of the plan - e.g. out of a book or original plans -,
-) the description - which means the house type like one-family house, terrace house, double house, farmhouse, dwelling-building, dwelling and office building, church, site-plan and town-plan -,
-) the quality - whether the walls of a floor plan are painted black, grey or kept white -,
-) if the floor plan includes furniture - the possibilities are: without any furniture, with sanitary fixtures only, with sanitary fixtures and partially other furniture and with both, sanitary fixtures and other furniture -,
-) if the floor plans include tiles - the possibilities are: terrace-tiles only, sanitary-tiles only, both, sanitary- and terrace tiles or no tiles -,
-) the environment - if the surrounding nature, e.g. a tree, but also neighboring buildings are taken into consideration in floor plans and elevations -,
-) the kind of presentation - floor plan, elevation, section, site-plan -, and additional information about
-) the floor-number - storey - and
-) the direction of the elevation.
The two categories "floor plan data" and "elevation data" on the right side of the data sheet again give additional information about the image: e.g. about
-) the roofline - if the floor plans show broken or unbroken roof lines -,
-) the rectangularity - if the image looks orthogonal, partially grown or naturally grown -,
-) the presence of an annex,
-) if there is any symmetry in the floor plans,
-) if there is any symmetrical distribution of the windows in the case of elevations,
-) the presence of wooden gables or sight masonry,
-) whether or not it is a gable-elevation, and information about
-) the facade - whether it is smooth, partially structured or structured. Beyond that, the definition factor, the number of pixels for X- and Y- direction of the bitmap and the scale is given for each image for the computer programs "Benoit" - using bmp-files -, "Fractal Dimension Calculator" - using pict-files - and "Program to Calculate Fractal Dimension - ‘DOS’" - using bmp-files with a certain maximum size. Finally the dimensions of the floor plans, elevations and site-plans have been calculated and supplied with information about the slope - either the log-log curve of the number of boxes versus the number of base-line-boxes is diverging or smooth in comparison to the replacing line - and about the procedure, that is the way how the dimension is calculated - including the smallest box-size in pixels, the box number of the starting observation and the direction, which means if the smaller or greater box-sizes are used for calculation.
The interest, the aim of the data set, is to find out possible influences of certain variables, e.g. that of house type, size and roughness of the elevation, on the box counting dimension. Tile lines in a floor plan for example may be interpreted as an additional information which may lead to a higher dimension - which it actually does as we will see later in this paper. By that it might be possible to make some classifications with regard to the resulting dimensions, for example family houses have a wider range of dimensions - that is there are many different possibilities of design, from smooth to very rough examples - in contrast to terrace houses, which have a lower range. Another classification may be done with regard to times or styles, e.g. it seems that Gothic buildings have a higher dimension than modern buildings.
The three graphs on the right show the different possible slopes of the log-log curve. The continued curve with the dots offers several points of the measurement - occupied boxes versus side length. A straight line, the dotted trend line, which is the average line, replaces this curve - the slope of this dotted line determines the fractal dimension. In the data-sheets the slope stands for the distribution of measured points - the dots of the graph - of the log-log graph: if all of them are situated on the replacing line, the "slope" is called very smooth; if some of them lie a little bit away, it is called smooth; finally if some points are situated even farther away from the average-line, it is called diverging. This last category is excluded from further research, because the results are too inaccurate. In general bigger box-sizes - on the left sides of the graphs - cause lines diverging more often.
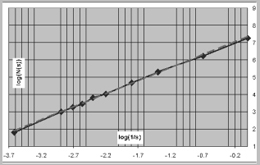
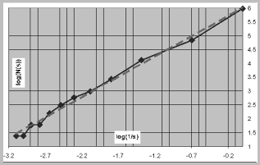
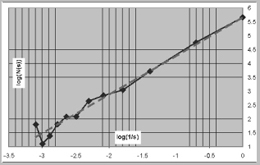
3453 sets of data of 1178 different buildings have been prepared in this evaluation. These sets of data have been analyzed with the aid of the computer program "SPSS for windows", using different comparisons of variables and dimension, e.g. the roughness of elevation is compared with the dimension-category, or the dimension is put opposite the quality of floor plans.
The minimum-, the maximum- and the mean value alone do not give us any exact conclusion. So it is much better to consider the box-plot graphs on the following pages, which show the median, quartiles, and extreme values. The box represents the interquartile range, which comprises 50% of the values. The upper and lower lines indicate the highest and lowest values, excluding outliers; the thicker line across the box indicates the median. The median represents the value above and below which half the cases fall - that is the 50 percentile - and the 95% confidence-interval of the mean value is the region where the real mean value is situated including the outliers - the "real mean value" is positioned within this interval with a possibility of 95%.
In the following the data are separated in two different sets, one that relates to the "Benoit" data set and the other to the "Fractal Dimension Calculator". Both computer-programs use the box-counting method, with "Benoit" running under "windows" and "Fractal Dimension Calculator" on "apple-computers". In the following section first the results of the floor plans for "Benoit" (I) and the "Fractal Dimension Calculator" (II) are given, and then those of the elevations, again for both computer-programs (III/IV).
The first example compares the dimensions with regard to the method - this stands for the computer-program -, the house type and the slope. Looking at the table below right we can separate the data of the mean values of house types into three different categories:
1st category consists of the house types:
double houses (*);
terrace houses;
one-family houses;
farmhouses;
In this category the calculated mean values lie between 1.48 and 1.50. All examples of house types of this category belong to the group of smaller buildings with fewer rooms counted.
2nd category consists of the house types:
dwelling buildings (*);
public buildings (*);
office and public buildings (*);
In this category the calculated mean values lie between 1.53 and 1.56. The reason for the higher dimension of the floor plans of these house types may lie in the higher scale of the plans, which means more information on a smaller space, bigger drawn lines with regard to the empty rooms in between and mostly black drawn walls and in the bigger size of the house types themselves.
3rd category consists of
town-plans (*) with a calculated mean value of 1.64.
The set of house types which are marked with a star (*) only include a few examples - compare with the table right above, where "N" is the number of examples. Because of that it is hard to make an evaluation, but the results nevertheless offer a direction, which means that a tendency can be seen.
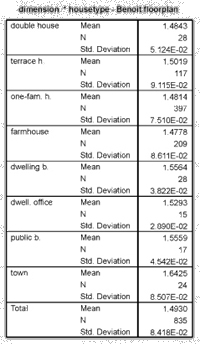
Symmetrical distribution of the box-plot indicates that the real mean value and the calculated mean value of the 95% confidence interval are quite similar. In this sense the examples of one-family houses, towns and terrace houses are symmetrically distributed in contrast to double houses and public buildings whose medians fall low with regard to their interquartile range - see the box-plot below.
For example the median of double houses, which is 1.475, is smaller than the calculated mean value, being 1.484. This means that there are more examples - floor plans - below the calculated mean value than above it. This causes a smaller real mean value than 1.484. But for this house type there are too few values - "N"=28 -, for making an exact conclusion.
In the case of farmhouses the median results in 1.49 and the calculated mean value in 1.478, which indicates that there are more examples above the calculated mean value. Following from that, the real mean value is bigger than 1.478. The reason for this difference is that the distribution of the dimensions consists of more than one peak in the curve - there are two regions with an accumulation of values; see the image right below. The first ranges from 1.39 to 1.44 and the second from 1.50 to 1.59.
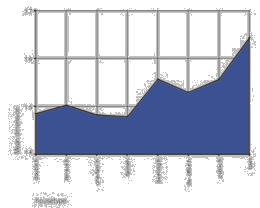
For the cases of terrace houses and one-family houses the calculated mean value - 1.50 and 1.48 respectively - and the median - 1.50 and 1.48 respectively - are identical, which is an indication for the "correctness" of the values. Besides the number of examples are 117 respectively 397, which is enough for making an evaluation.
The box-plot graph also tells us that in the cases of farmhouses - from 1.42 to 1.56 - and terrace houses - from 1.43 to 1.56 - the 50%-box-range reaches from smoother to rougher examples - so there is a bigger spread of different types, means roughness, of floor plans.
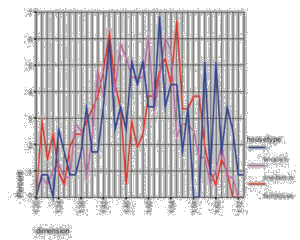
In sum there are more values present than for the "Benoit" data set. But nevertheless the same tendency and similar separation into three categories can be done, with one exception: the terrace house type this time belongs to the second category.
1st category consists of the house types:
double houses (*); one-family houses; farmhouses;
the calculated mean values lie between 1.437 and 1.456.
2nd category consists of the house types:
terrace houses; dwelling buildings (*); public buildings (*); office and public buildings (*);
the calculated mean values lie between 1.49 and 1.52.
3rd category consists of
town-plans (*) with a calculated mean value of 1.64.
In general the dimensions of the "Fractal Dimension Calculator" program are smaller than those of the "Benoit" program, except in the cases of terrace houses and towns where they remain the same.
For most house types in this category there are too few values to draw some conclusions, except for the farmhouses. The calculated mean value of the "Benoit" program is 1.533 and that of "Fractal Dimension Calculator" 1.527, which is quite similar. The calculated mean values for the floor plans are much smaller, namely 1.478 for "Benoit" and 1.456 for "Fractal Dimension Calculator". That says something about the higher degree of information of elevations. The conclusion from that may be that for farmhouses the elevations are "rougher", because of wooden elements, asymmetric parts and sight masonry, than the floor plans. In any case the ratio of empty areas with regard to black lines - or filled areas of walls - in the floor plans is higher than for elevations.
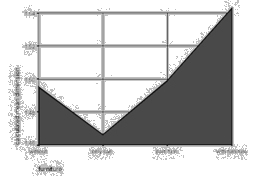
The more furniture is present in the plans, the higher the dimension is. This means that the more lines can be found in a plan the more information is given to us. But there is also another observation, namely that if no furniture is present, the dimension is higher than with sanitary fixtures. The reason may be that the plans of the first category are in general on a smaller scale with black painted walls, which would mean a higher percentage of thicker lines of walls in respect to the "white" rooms.
The calculated mean values are:
"without furniture": "Benoit": 1.495; "Fractal Dimension Calculator": 1.467
"only sanitary fixtures": "Benoit": 1.466; "Fractal Dimension Calculator": 1.428
"partially": "Benoit": 1.499; "Fractal Dimension Calculator": 1.439
"with furniture": "Benoit": 1.543; "Fractal Dimension Calculator": 1.562
Though for the categories "with tiles" and "with terrace tiles" there are only a few examples - "N"=30 for "Benoit" -, it nevertheless underlines the tendency of increasing dimension by increasing tiles. But the same phenomenon as in the previous category can be found, namely that if no tiles are drawn, the dimension is higher than with sanitary-tiles. This may also result from a smaller influence of sanitary-tiles, because if both, terrace- and sanitary-tiles are present, the dimension unequivocally increases for "Benoit" from 1.52 to 1.585 - for the "Fractal Dimension Calculator" it even decreases.
The calculated mean values are:
"without tiles": "Benoit": 1.483; "Fractal Dimension Calculator": 1.456
"with terrace-tiles": "Benoit": 1.520; "Fractal Dimension Calculator": 1.573
"with both tiles": "Benoit": 1.585; "Fractal Dimension Calculator": 1.540
Comparing the values of "Benoit" with the results for the computer-program "Fractal Dimension Calculator" shows that the ranges of the box-counting dimension for "tiles" are not far away from each other: for the category "without tiles" the calculated mean value of the dimensions for the images is 1.456 for "Fractal Dimension Calculator" and 1.483 for "Benoit", which is only a little bit higher.
The color of the walls has an obvious influence on the resulting dimension. For all categories - black painted walls, grey and white walls - there are enough values to draw clear conclusions. The category "white walls" has the absolutely smallest dimension with a calculated mean value of 1.426 - once more regarding dimension as an indication of information, "white walls" mean two lines without any information for the user in between. The category "grey walls" interprets this middle part as something with additional information, which cannot be touched or seen with eyes but is nevertheless present - here the dimension increases to 1.472. Finally "black walls" have a calculated mean value of 1.523 - interpreting each part of the wall as additional "information". In all of these three categories the median and the calculated mean value are close together, which indicates the exactness of the values.
For the category of "white walls" we only have few values, which may be the reason why in the case of "Fractal Dimension Calculator" this category has the highest calculated mean value with 1.500. The other two, the "grey walls" - 1.426 - and "black walls" - 1.482 - show the same tendency as before. Again the dimensions for "Fractal Dimension Calculator" are, in general, lower than those for "Benoit".
Under the supplement of floor plans it turns out that the fact whether the walls are situated orthogonally or look naturally grown has not that much influence on the resulting dimension: the box-counting dimension ranges from 1.487 for "rectangular" plans, over 1.517 for "partially orthogonal" plans to 1.472 for "naturally grown" examples. "Naturally grown" in this connection just means that the floor plan is not rectangular but curved or it consists of angles lower or higher than 90 degrees. None of the results has a symmetrical distribution of the box-plot graph, especially that of "naturally grown".
The calculated mean values are:
"orthogonal": "Benoit": 1.487; "Fractal Dimension Calculator": 1.458
"partially orthogonal": "Benoit": 1.517; "Fractal Dimension Calculator": 1.499
"naturally grown": "Benoit": 1.472; "Fractal Dimension Calculator": 1.481
One conclusion is that rectangularity leads to smaller dimensions than for "partial growth", which is true for both, "Benoit" and "Fractal Dimension Calculator". Then the dimension for "natural growth" is lower than for "partial growth", which can arise from the fewer data available - "Benoit": "N"=59. In addition to that in case of the "Benoit" program the presence of more values in the lower field - the median is situated in the lower part of the box - reduces the real mean value once more in respect to the calculated one. This is also true for the results of the "Fractal Dimension Calculator" data set, where more data is available - "N"=68. But in the latter case the calculated mean value is higher than the one for the category "orthogonal".
Between the categories "without" and "partially lined" there is no significant difference - 0.006 -, while the category "roofline" offers a little smaller dimension, which may once more result from a smaller number of data - "N"=53. Besides the first two categories offer so-called bell-curves, while the third is jagged which indicates a bad distribution.
The calculated mean values are:
"without roofline": "Benoit": 1.496
"part. roofline": "Benoit": 1.490
"with roofline": "Benoit": 1.435
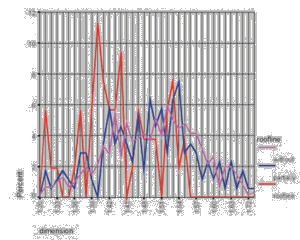
This time the curves offer a distribution of a bell-curve for all three categories, which seems to be a more realistic result, because it is well balanced. In this case the dimension increases from the category "without" - 1.460 -, over "partially lined" - 1.491 - to "with broken roofline" - 1.491. The very small differences between these three values show that the influence of the broken roofline is very small.
The results of the elevation-roughness indicates that the smooth elevations have a much lower dimension - the calculated mean value is 1.369 for "Benoit" - than the partial rough ones - 1.583. This proves that the dimension is an indicator of roughness and by that of information. The median of the category "very rough facades" - with only 39 pieces of data - is situated in the upper part of the box, so the real mean value is lower than the calculated one, which is 1.667.
The calculated mean values are:
"smooth elevation": "Benoit": 1.369; "Fractal Dimension Calculator": 1.462
"partially structured": "Benoit": 1.583; "Fractal Dimension Calculator": 1.549
"structured elevation": "Benoit": 1.667; "Fractal Dimension Calculator": 1.543
After analyzing the data with "SPSS for windows" it seems that there are some variables, which have no or only little influence on the dimension, that is they cannot be linked to the fractal dimension. Beside that the influence may be undiscovered because of too few or too different examples, e.g. in their quality. "Storey" and "scale" in the case of floor plans, "number of floor plans" in the case of elevations seems to belong to the first category with no influence, which does not offer any tendency.
With only few examples the categories "environment", "size" - the tendency, however, shows that dimension seems to increase with size - and "kind" - the whole object having a higher dimension than the part - belong to the second category. It also seems that buildings of the year 1900 have a higher dimension than those of the 1940ies, but again there are not enough examples.
The following examples are taken from the book "Alte Bauernhäuser in den Dolomiten" by Edoardo Gellner. The original images of the elevations - scanned with a definition factor of "300 ppi"- were analyzed with the computer-program "Benoit". Those resulting points of the log-log graph that are situated beside the slope being excluded from measurement - that reduces the standard deviation, SD, and by that increases the exactness of the replacing line.
On the one hand the results below indicate that the different elevations of one and the same building may offer different roughness - main-elevation and side-elevation - and that on the other hand, similar characteristics of elevations lead to similar dimensions which is underlined by placing a certain letter beside the images: A=dimension above 1.66; B=1.61-1.65; C=1.56-1.60; D=1.51-1.55; E=1.46-1.50; F=1.41-1.45; G=1.31-1.40; I=1.20-1.30. Zoldaner-Cadoriner type house De Sandre in Laggio house Domen in Pelos house De Sandre in Laggio house Mas de Sabe in Mas di Sabe Tabià Fattor in Mareson Tabià Brustolon in Foppa
The tables on the following pages compare the dimensions of elevations - the images are taken from "Alte Bauernhäuser in den Dolomiten" and scanned with "300ppi" - measured with the computer-program "Benoit", using an increment of grid rotation of 15 degrees, with those measured with an increment of grid rotation of 0 degrees and the computer-programs "Fractal Dimension", "Fractal Dimension Calculator" and "Program to Calculate Fractal Dimension" respectively. For all measurements with "Benoit" the smallest three and largest three box-sizes were excluded from calculation to increase the exactness of the replacing line. The results of the tables indicate that the five dimensions, calculated for every image, are more or less the same - those values, which diverge by a value more than 5% with regard to the "original result" of the first row are pointed out by numbers in italics and by underlining them, those that diverge more than 10% are put into brackets -, the "Fractal Dimension Calculator" being the program which diverge most.
The elevations above show similar buildings in the way that the surfaces are mostly smooth with the only "information" given by windows and few balconies. This causes similar dimensions, which remain within a range from 1.28 to 1.40 - "original results" of the first row.
The examples below all offer a smooth facade with a larger portion of balconies in respect to the first group, situated in the upper storeys. The only exception is the 9th elevation, which is very smooth on the left and regularly structured on the other half. In addition to that most of these elevations are more or less symmetric.
The examples above and below - the images of the latter are given on the upper part of the next page - are much more structured than the previous ones - balconies, wooden paneling and wooden gables - and they are mostly not symmetric. The "original results" of the first row ranges from 1.505 to 1.553 and from 1.556 to 1.579 respectively.
The following elevations are mostly structured - large parts being made of wooden elements - and the symmetric, smooth parts are minimized.
Computer-program "Benoit" - measurement of elevations: farmhouses-results.pdf
Evolutionary algorithms enhanced with sAI in architectural design
Talk and Proceeding: eCAADe 2025 – Confluence (Ankara, Turkey | conference)
This research is concerned with the automation of the user interventional aspect within interactive genetic algorithms (IGA) as already explored in previous publications by the authors considering their use for Gestalt analyses and generative design optimization. ...
in: DAP / Re:Search_2020.2025
S. 244 - 257, Research Department for Digital Architecture and Planning, TU Wien (Publisher)
Interview with Wolfgang E. Lorenz on research, teaching, and practice, especially over the last 5 years
4th Digital Geographies Conference 2025
Artificial geographies: opening the black box for a new wave of critical thinking.
Predicting Material Composition of Walls and Floors using Machine Learning...
Proceedings of the ALGOPLANA Conference 2025
Research-driven education (“Forschungsgeleitete Lehre“) is common throughout TU Wien, be it in the form of seminars, labs or lectures. ...
Algorithmic design of a Flagship Store
After successful completion of the course, students are able to understand the design process as a problem that can be split into solvable sub-problems. Furthermore, they are able to develop a solution strategy with the help of algorithms. The students acquire
in: 90 Jahre Pfarre Maria Lourdes (Festzeitschrift)
S. 13 - 16, Pfarrgemeinde Maria Lourdes (Hrsg.)
Die Maria Lourdes Kirche steht in der Tradition sakraler Gebäude, interpretiert deren Elemente aber neu. Dadurch erscheint sie als ein Bauwerk seiner Zeit. Sie zeigt neben modernen Umsetzungen von Symbolen, wie der sinnbildhaften Darstellung eines Kirchenjahrs mittels liturgischer Farben,. ...